Energy System Data Companion
Assets, Grids, Investment Flows, and System Constraints in Europe
Companion notes for investors and policy makers: what infrastructure and policy tools already exist in Europe, what they enable for decentralised energy, and how to read the diagrams.
Data & Infrastructure Annex (Policy & Investor Companion)
This annex accompanies the article “Europe’s Energy Paradigm Shift: Democracy, Regeneration, and Strategic Opportunity”. It demonstrates that Europe’s decentralised energy challenge is institutional rather than technological.
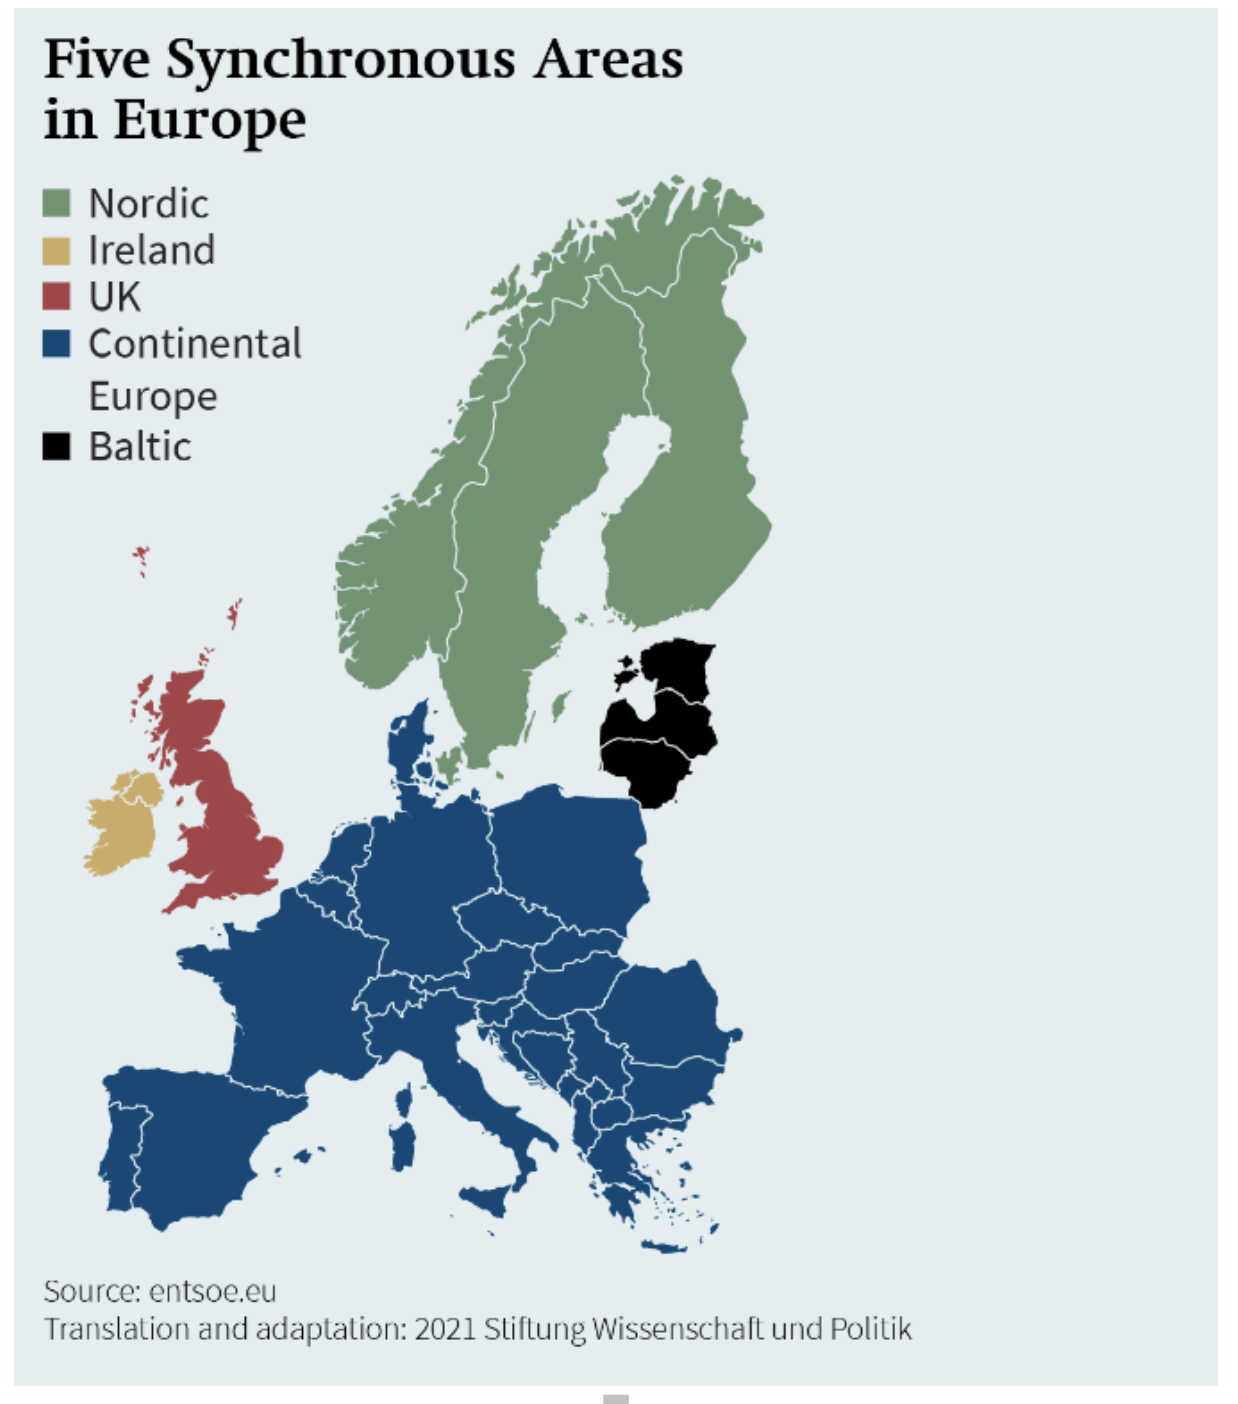
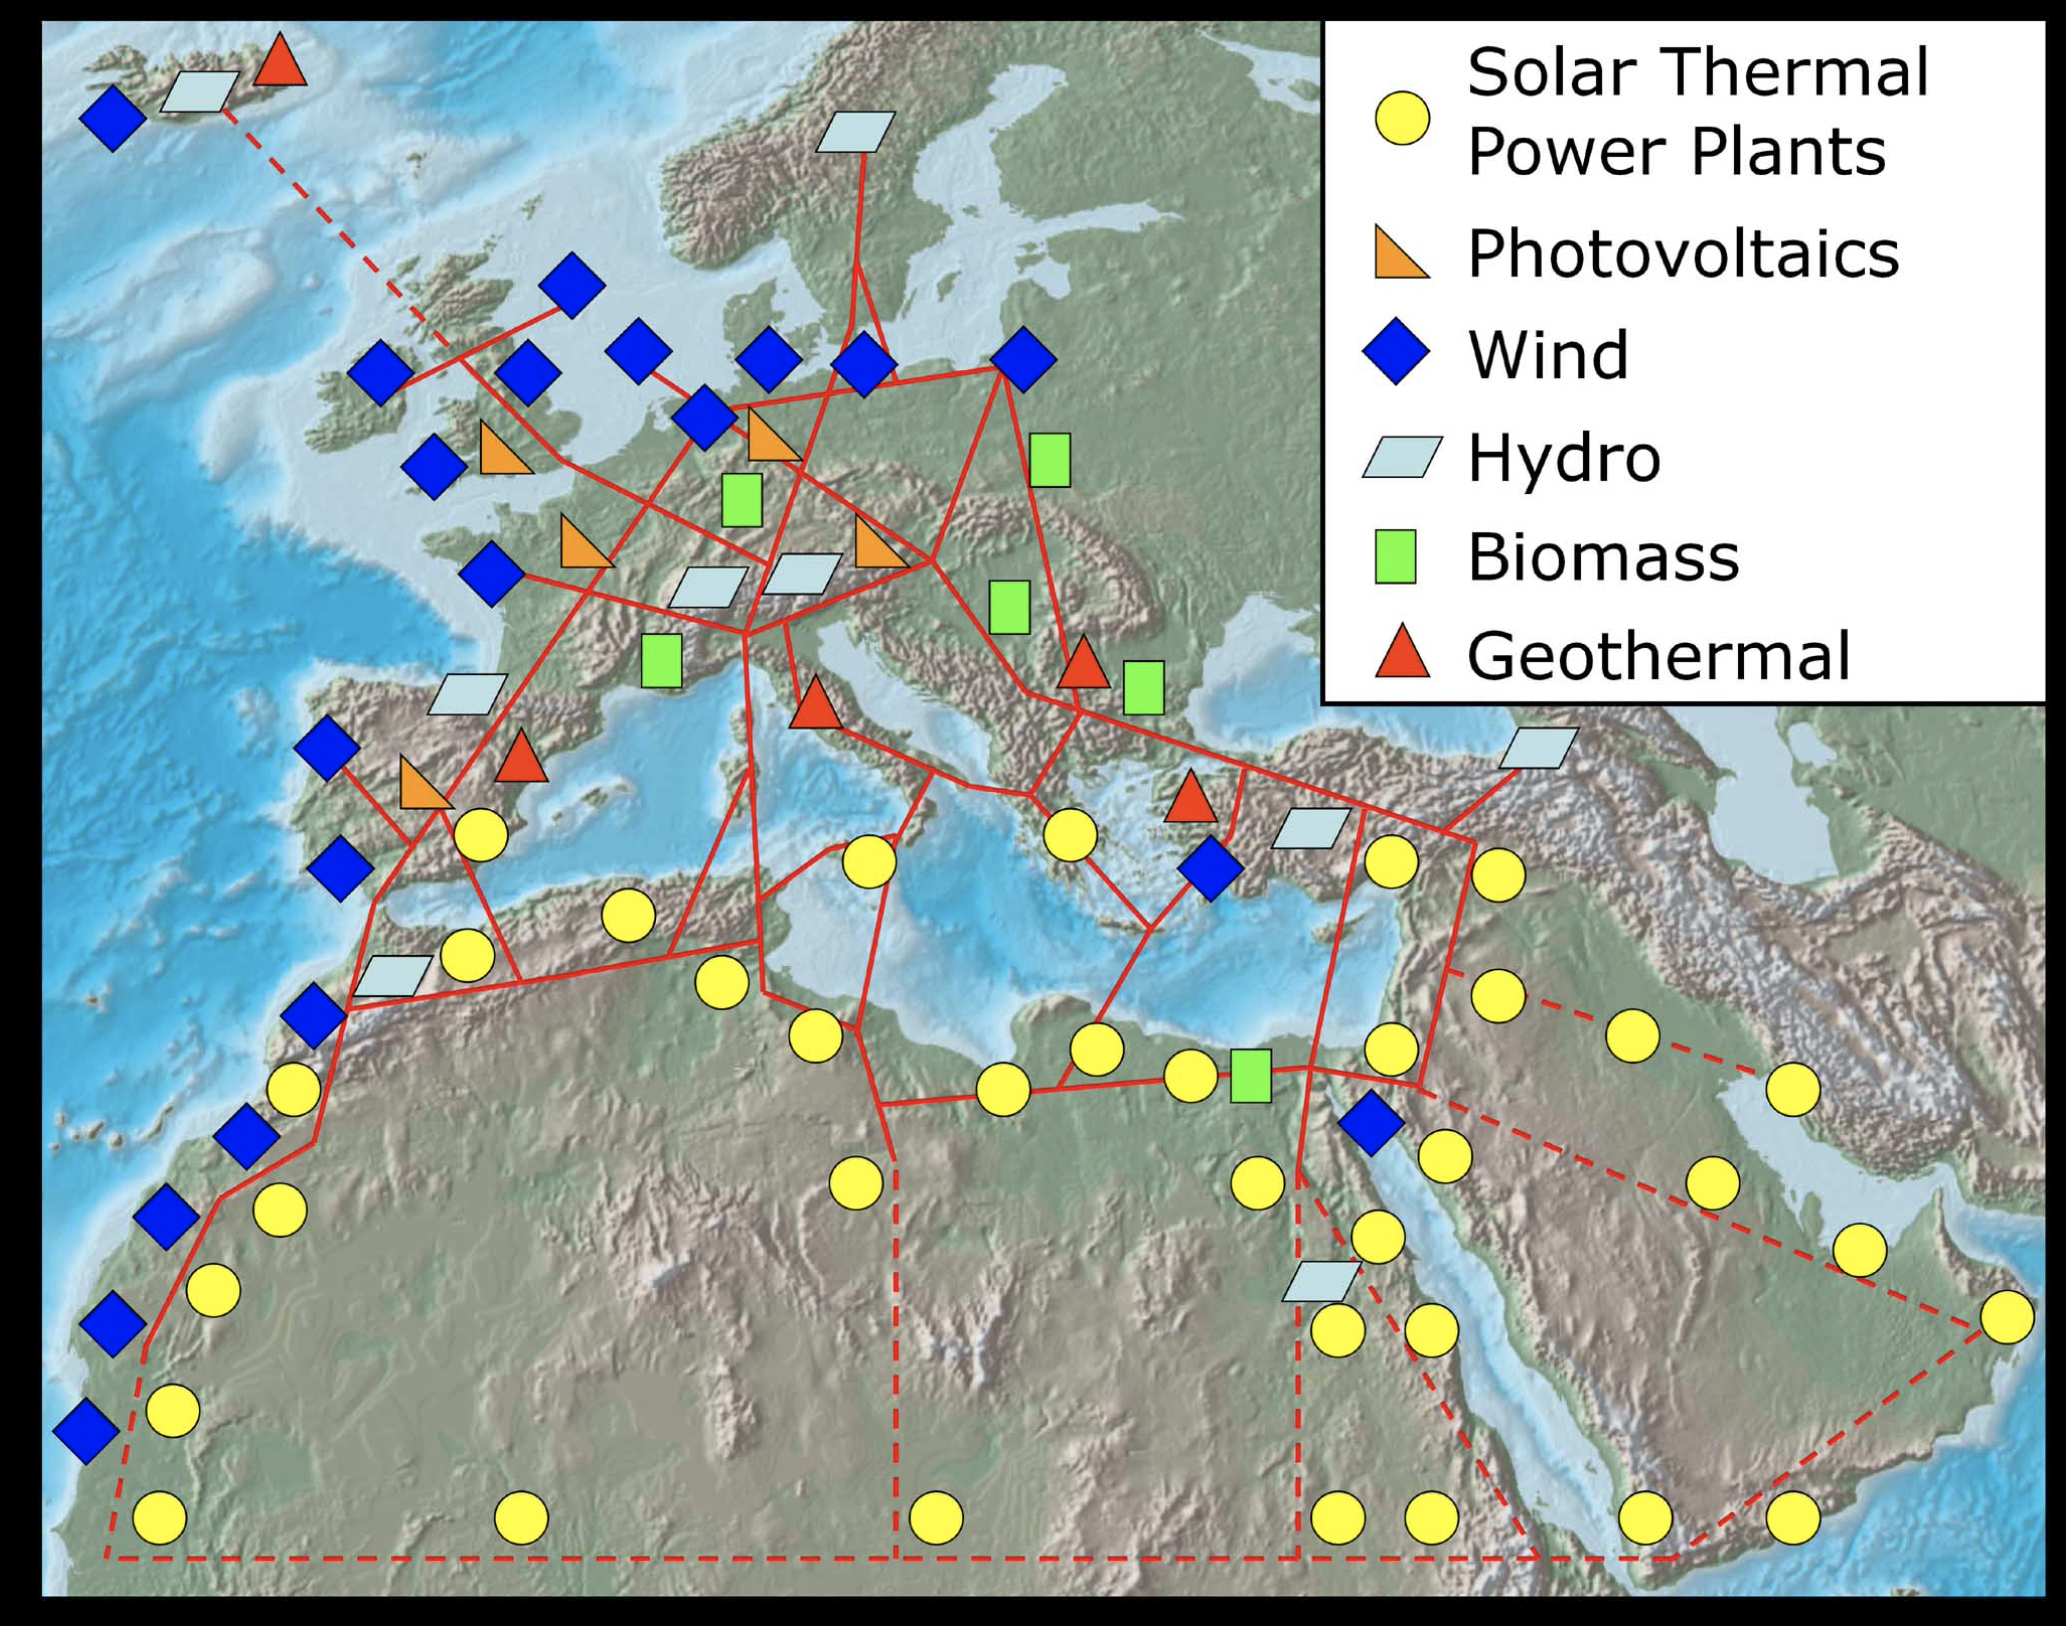
1. Quick map: what Europe already has
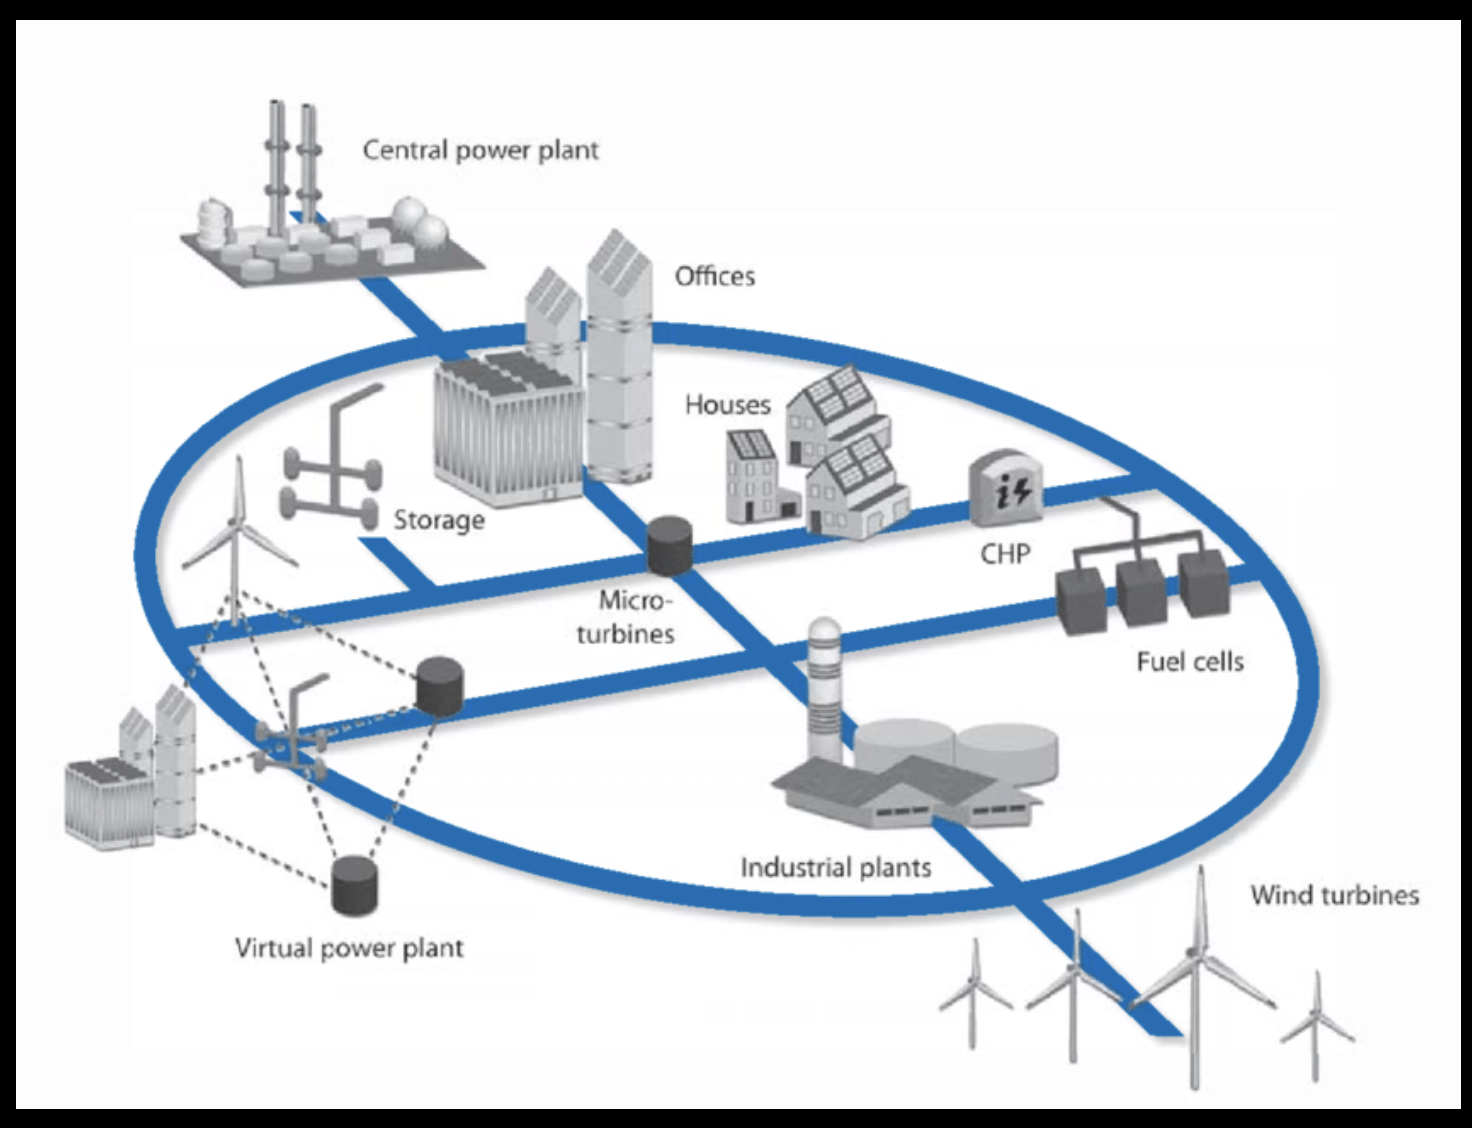
2. System architecture: how decentralised energy actually works

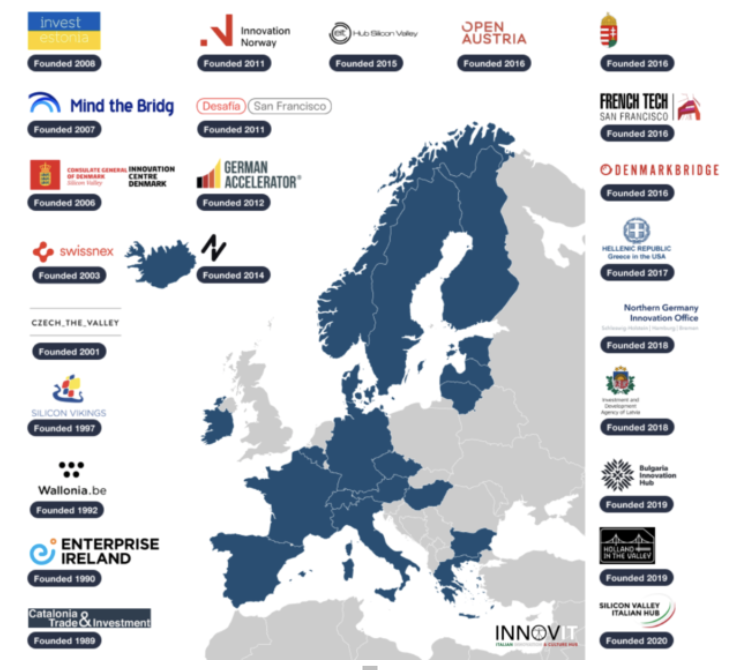
3. What is available in Europe — concrete building blocks


Taken together, the figures above indicate that Europe’s challenge lies less in technical readiness than in institutional coordination and market design.
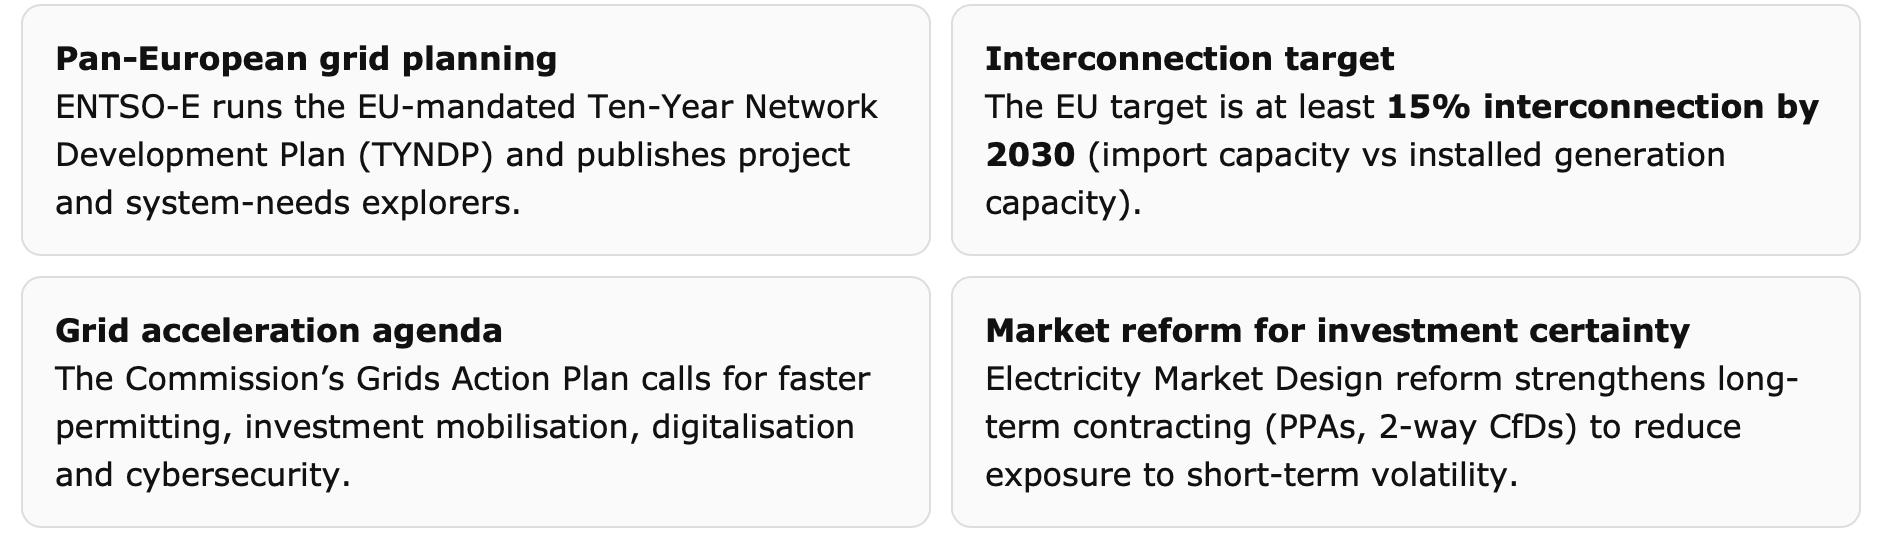
4. Europe-wide Electricity Transmission & Interconnection
What this shows: Dense EU-wide grid and cross-border interconnections.
Why it matters: The constraint is coordination, not infrastructure absence.
Reference: ENTSO-E TYNDP; European Commission Energy Union.
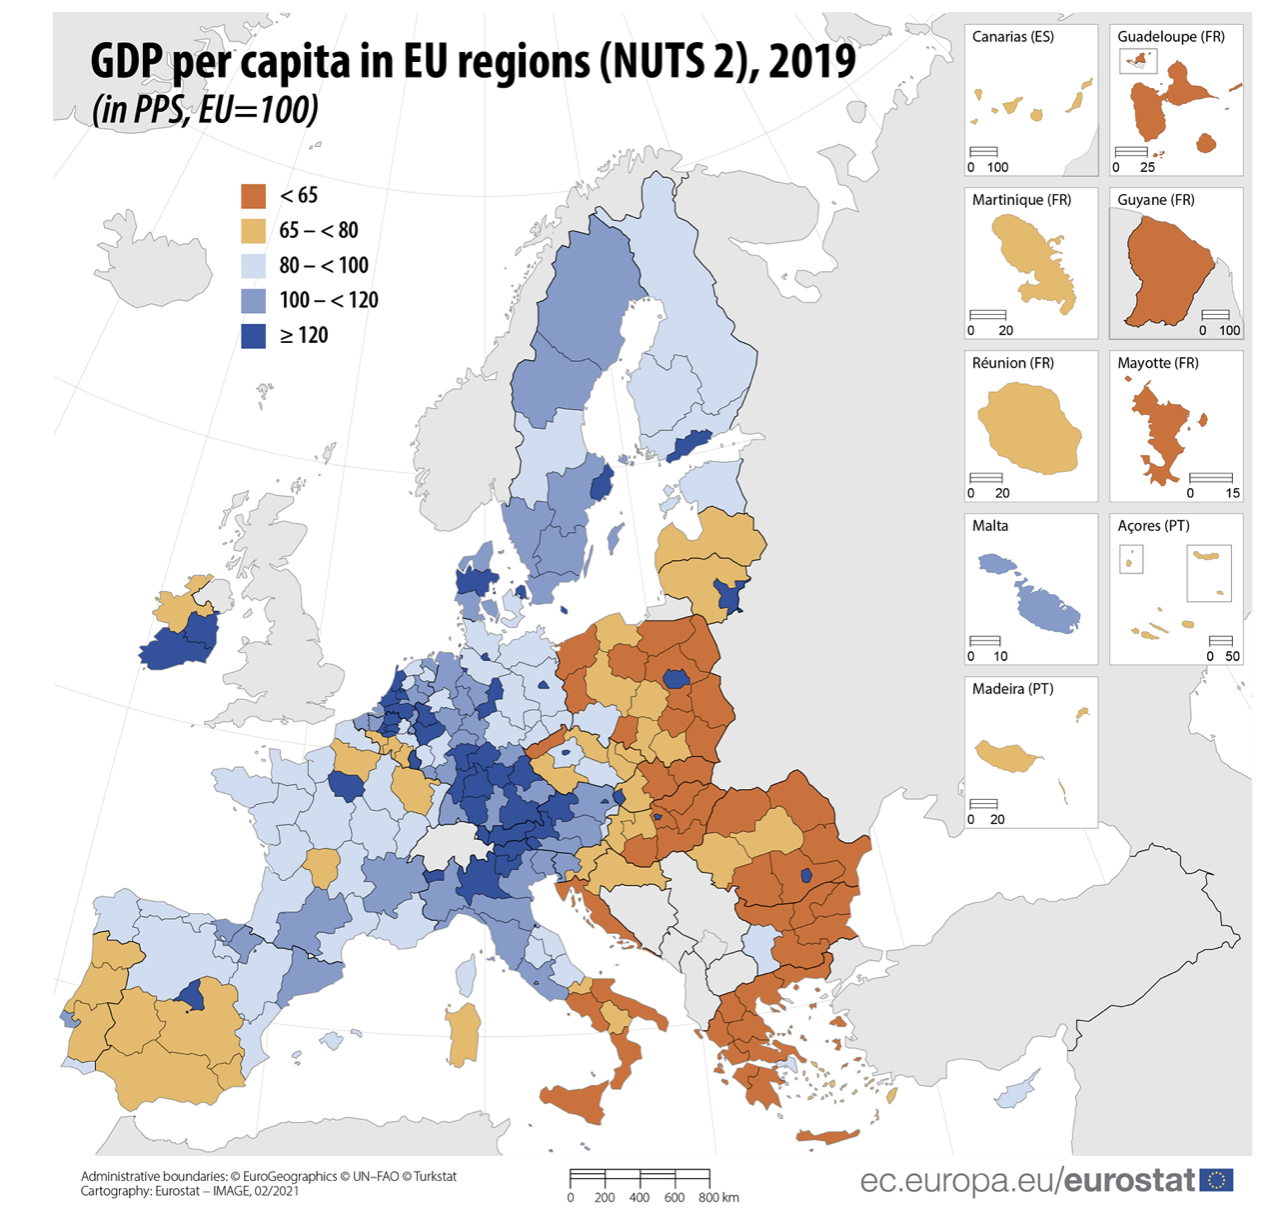
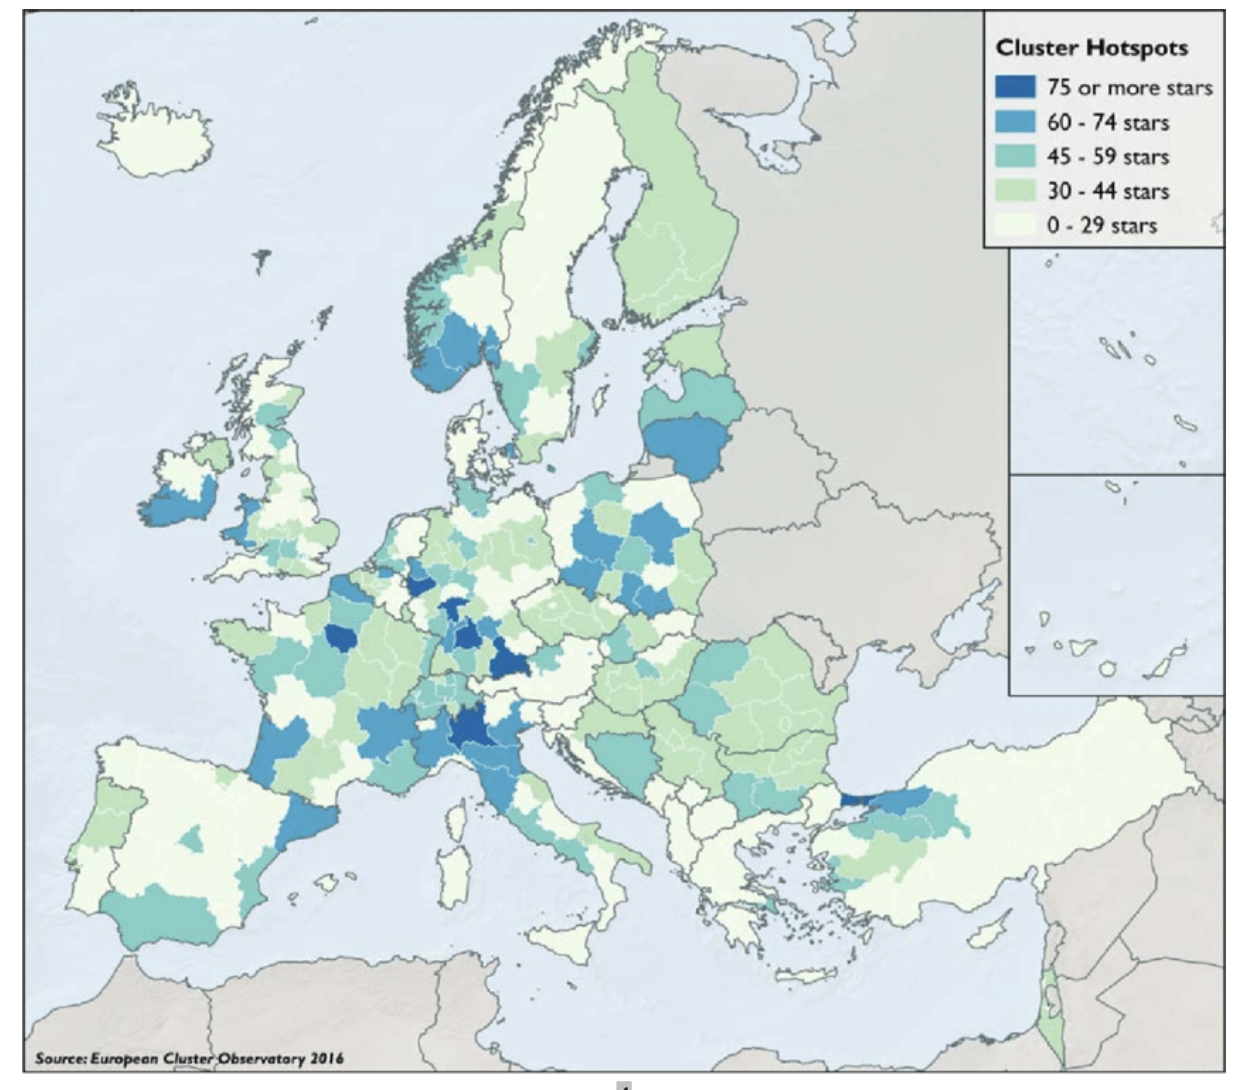
5. Regional Differentiation Across Europe
What this shows: Strong regional variation in energy and industry.
Why it matters: Centralised models struggle in heterogeneous systems.
Reference: EU regional energy and cohesion data.
6. Energy System Stack and Value Chain
What this shows: Layered system from hardware to services.
Why it matters: Value migrates upward to orchestration.
Reference: Energy systems literature.
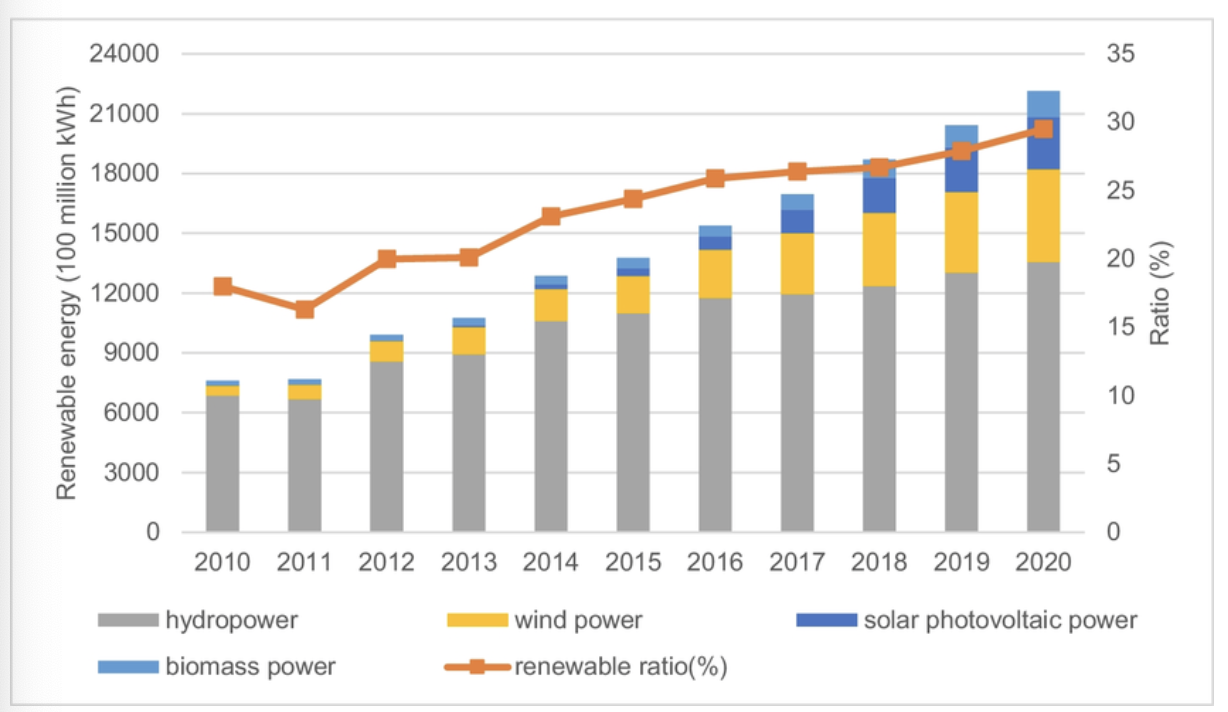
7. Renewables at System Scale: Rising Integration Pressure in Europe
What this shows: The share of electricity from renewable sources in the EU has almost tripled since 2004, reaching 47.5% in 2024.
Why it matters: At this penetration level, the binding constraint shifts from installing generation to integrating variability—grid capacity, congestion management, storage, demand response, balancing, and digital coordination.
Policy relevance: Grid acceleration, market design, and flexibility mechanisms become as decisive as deployment targets.
Investor relevance: System-scale renewables create persistent demand for integration services (storage, optimisation, aggregation), shifting value from commodity sales to system performance.

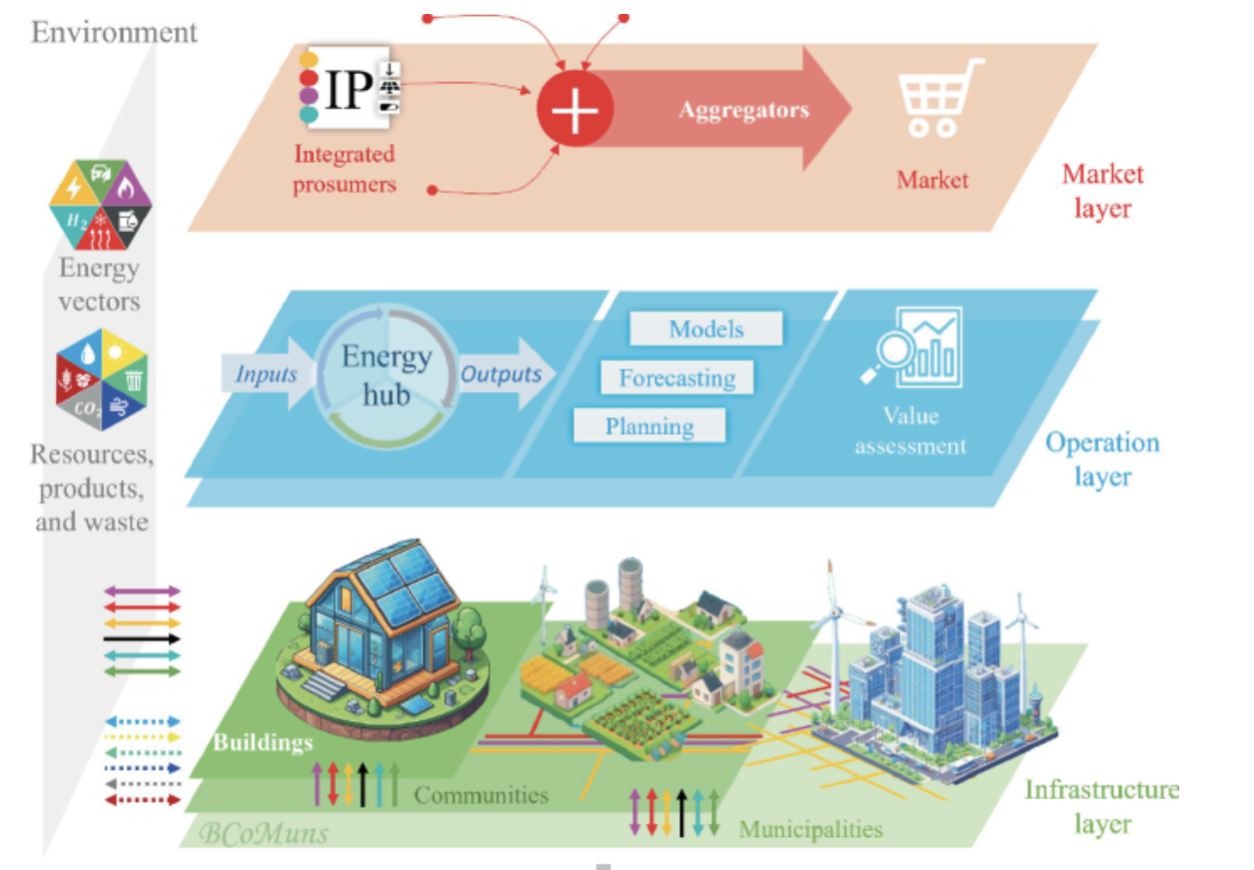
8. Decentralised Energy as a Coordinated System(Aggregation & Market Integration)
What this shows: A layered architecture in which distributed assets (buildings, communities, municipalities) are coordinated through energy hubs and aggregators, linking physical infrastructure to operational models and market participation.
Why it matters: Decentralised energy scales through aggregation, not isolated projects. Control shifts from owning generation to orchestrating portfolios—forecasting, optimisation, and flexibility delivery.
Policy relevance: Sovereignty is exercised through rules, interoperability, and market access (who can aggregate, bid, connect, and be paid), not through owning every asset.
Investor relevance: Bankability emerges at portfolio level, where aggregated cashflows (flexibility, balancing, optimisation) can be contracted and financed.
9. EU Grid Planning & Coordination
What this shows: EU-level grid planning capacity.
Why it matters: Decentralisation ≠ fragmentation.
Reference: ENTSO-E; EU Grids Action Plan.
10. Aggregation & System Coordination
What this shows: Aggregation enables scale.
Why it matters: SMEs operate within systems.
Reference: Aggregation market design studies.
11. EU Project Pipeline
What this shows: Existing investment pipeline.
Why it matters: Bankability depends on policy.
Reference: ENTSO-E Project Collection.
12. European Industrial & Energy Clusters
What this shows: Regional ecosystem structure.
Why it matters: Supports specialisation.
Reference: EU industrial cluster mapping. Europe as functional regions

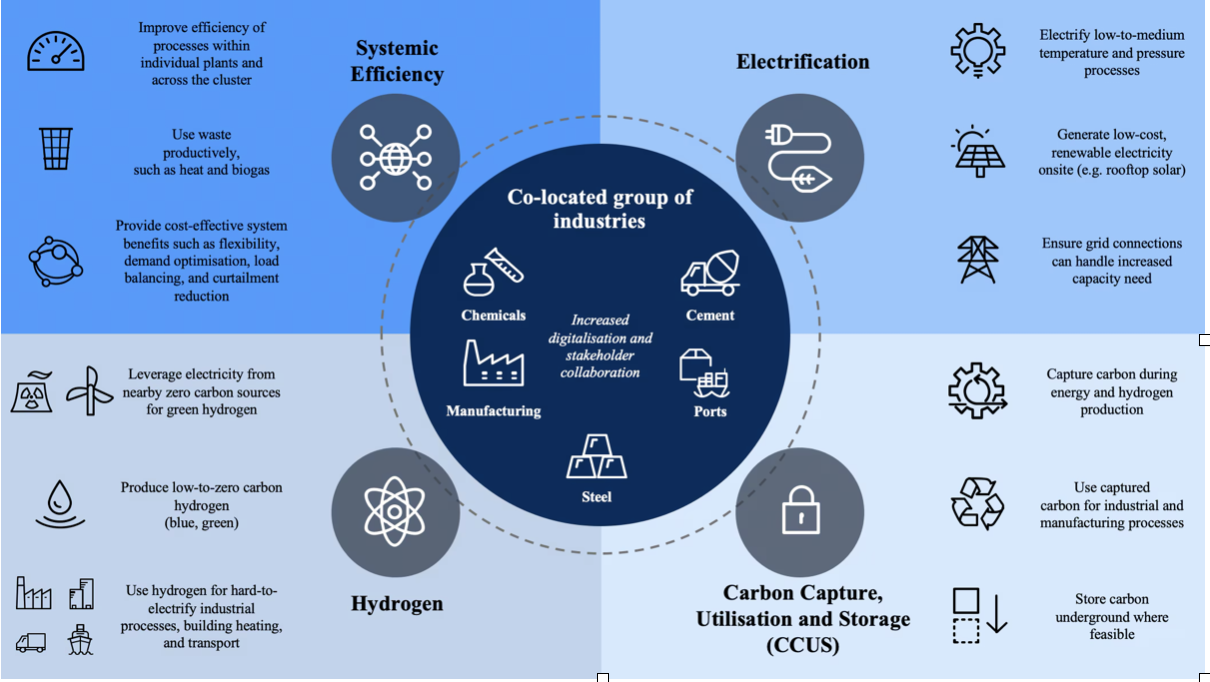
13. Regeneration through regional ecosystems: energy as industrial strategy
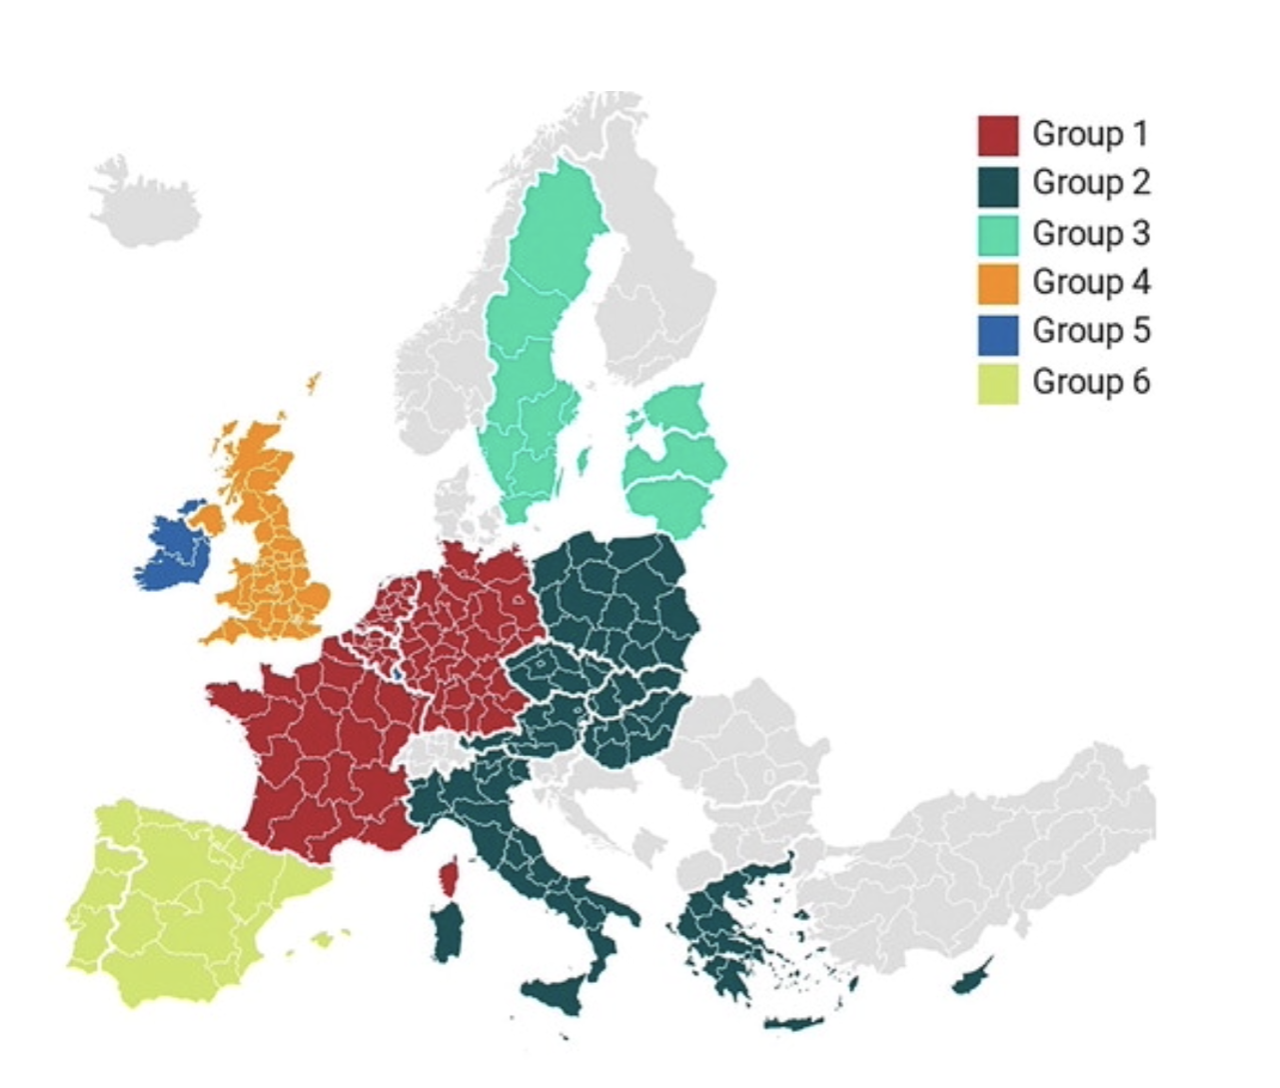
Regional coordination and governance groupings
Shows Europe divided into functional groups
Regeneration through regional ecosystems -
Energy transition as industrial strategy
- A systemic industrial decarbonisation framework
- Shows:
- co-located industries
- electrification
- hydrogen
- CCUS
- systemic efficiency
14. Asia / China Cluster Logic (Comparative)
What this shows: Ecosystem-based competitiveness.
Why it matters: Lesson, not benchmark.
Reference: Kuchiki & Tsuji.
15. System Feedback Loop
What this shows: Energy–economy–governance loop.
Why it matters: Structural paradigm shift.
Reference: Political economy systems analysis.
16. Illustrative example of a decentralised energy implementation (non-exhaustive)
This figure illustrates how decentralised systems may be implemented in practice; it is not prescriptive and does not imply endorsement of any specific vendor or platform.
- A vendor-specific IoT architecture
- Cloud platform (Microsoft Azure)
- IIoT gateways, inverters, sensors, batteries
- Operational control + business intelligence
[IMG]assets/imageA.png 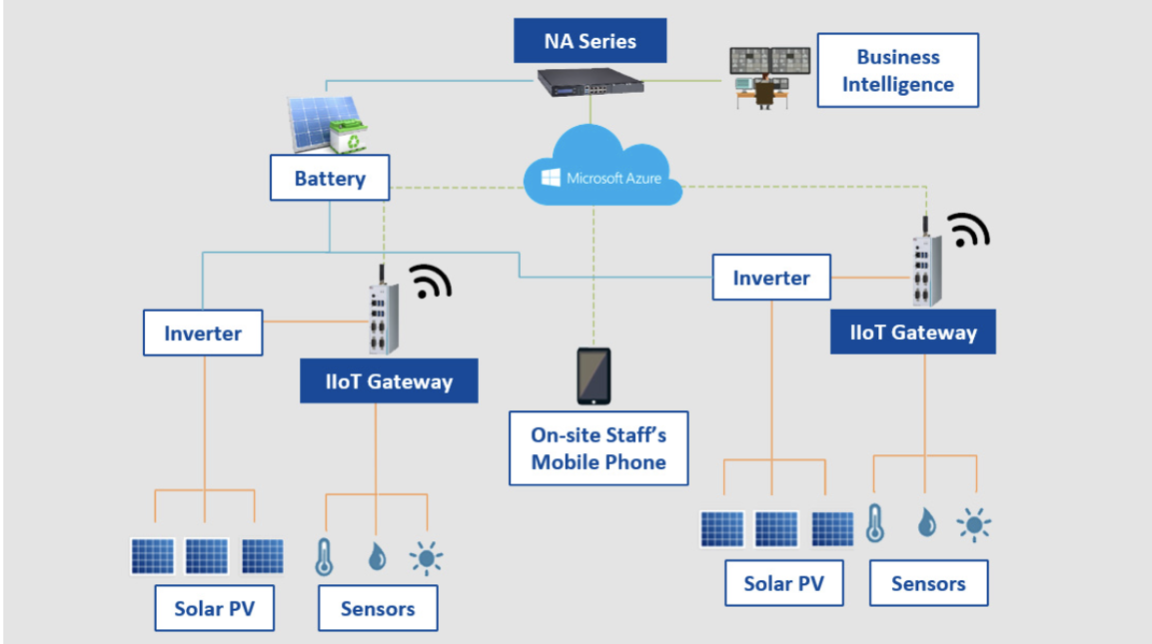
Suggested Strategic Reading
The following materials provide additional context for the structural dynamics examined across this project, particularly the interaction between energy systems, industrial capacity, capital allocation, and technological infrastructure.
Core Essays on this Site
EU Energy Paradigm Shift Explains how Europe’s industrial competitiveness and monetary space are increasingly shaped by energy cost structure.
AI Sovereignty Stress Test Examines how energy volatility and compute localisation shape technological sovereignty and digital infrastructure risk.
Energy Constraint and the Monetary Ceiling Traces the transmission from energy systems to industrial margins, capital flows, and monetary policy space.
Strategic Context
These external works provide broader analytical perspectives on energy systems, industrial transformation, and technological competition.
Vaclav Smil — Energy and Civilization
A foundational history of how energy systems shape economic structures.Daniel Yergin — The New Map
Explores the geopolitical implications of the evolving global energy landscape.International Energy Agency (IEA)
Global energy investment and transition analysis.International Monetary Fund — Energy Price Pass-Through Studies
Research on how energy shocks transmit into inflation and industrial margins.
References
- Decentralized Energy Systems, a Necessity in Europe
- Industrial Clusters in Asia: analyses of their competition and cooperation Edited by Akifumi Kuchiki and Masatsugu Tsuji
- European Commission: Electricity interconnection targets
- ENTSO-E: TYNDP 2024 overview
- ENTSO-E: Offshore Network Development Plans
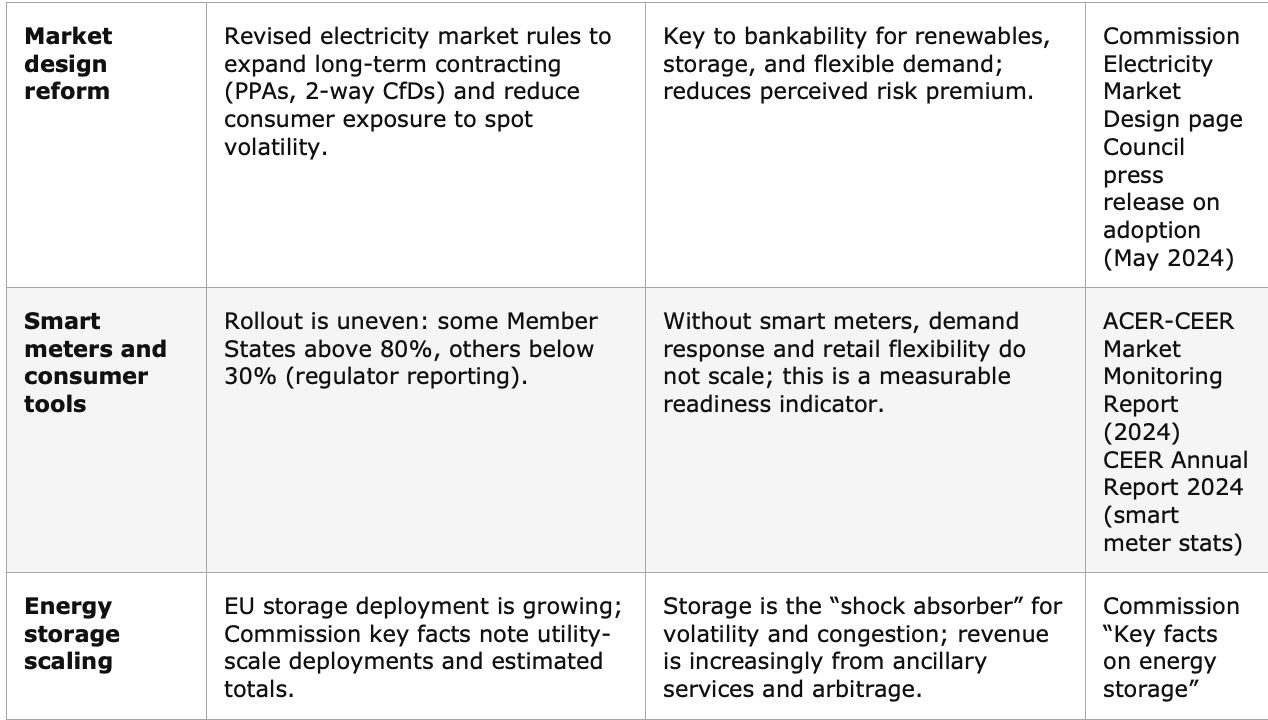
- European Commission: Electricity market design reform
- Council of the EU: Electricity market reform sign-off (21 May 2024)
- EUR-Lex: Grids Action Plan (COM/2023/757)
- European Commission: Key facts on energy storage
- ACER-CEER: 2024 Market Monitoring Report (Retail & consumer protection)
- CEER: Annual Report 2024 (smart meter deployment summary)
- European Commission: Net-Zero Industry Act overview
- EUR-Lex: NZIA summary
- European Hydrogen Backbone: infrastructure map